Why Middle-Market M&A Could Break Records This Year
Buoyed by rising business sentiment, pent-up demand and ample cash reserves, middle-market M&A deals are on track to reach record levels in 2021.
“We have good momentum, and some of the uncertainty has been removed in the economy,” says J.R. Doolos, Managing Director, Mergers & Acquisitions for KeyBanc Capital Markets® (KBCM). “In terms of the broad fundamentals driving the market, optimism is only going to continue to grow.”
A quarterly survey released by KeyBank, a subsidiary of Cleveland-based KeyCorp, showed a positive improvement in middle-market sentiment across the board in early 2021. More than half of the businesses surveyed said that they are “very likely” or “extremely likely” to complete an acquisition in the next six months.
Of course, the upsurge in deals will vary by industry, with healthcare and technology continuing to lead the way. Here’s a look at three factors driving the middle-market M&A boom:
1. Completion of transactions put on hold in 2020
Many deals on track for completion simply went into limbo when the economy shut down in spring of 2020.
“Processes that were just a few weeks away from closing in March or April of last year completely shut down,” Doolos says. “Those companies became dually focused on liquidity and running the business.”
By the end of 2020, the companies that survived began restarting the M&A process, creating a record backlog of deals closing through the first half of this year.
2. Accelerated deals due to tax concerns
More than half of the executives surveyed by KeyBank said that they’re concerned about the potential for higher tax rates.
“Some of the elements that have been put out by the Biden administration would be quite punitive for someone selling a business,” says Jeff Johnston, KBCM Managing Director & Group Head of Mergers & Acquisitions.
That has many entrepreneurs and business owners who have been planning to sell their business rushing to get it done this year to avoid the bigger tax bite, Johnston says.
3. Abundant liquidity
Amid the uncertainty of 2020, many public-sector corporations and private equity firms opted to sit on their cash reserves to see how the market played out. Now that the economy is starting to move again, they’re eager to deploy that cash.
“There’s $2 trillion held by private equity funds today in dry powder,” Johnston says. “And that’s just the equity. If you assume you can get four to six plus times leverage, the buying power is tremendous.”
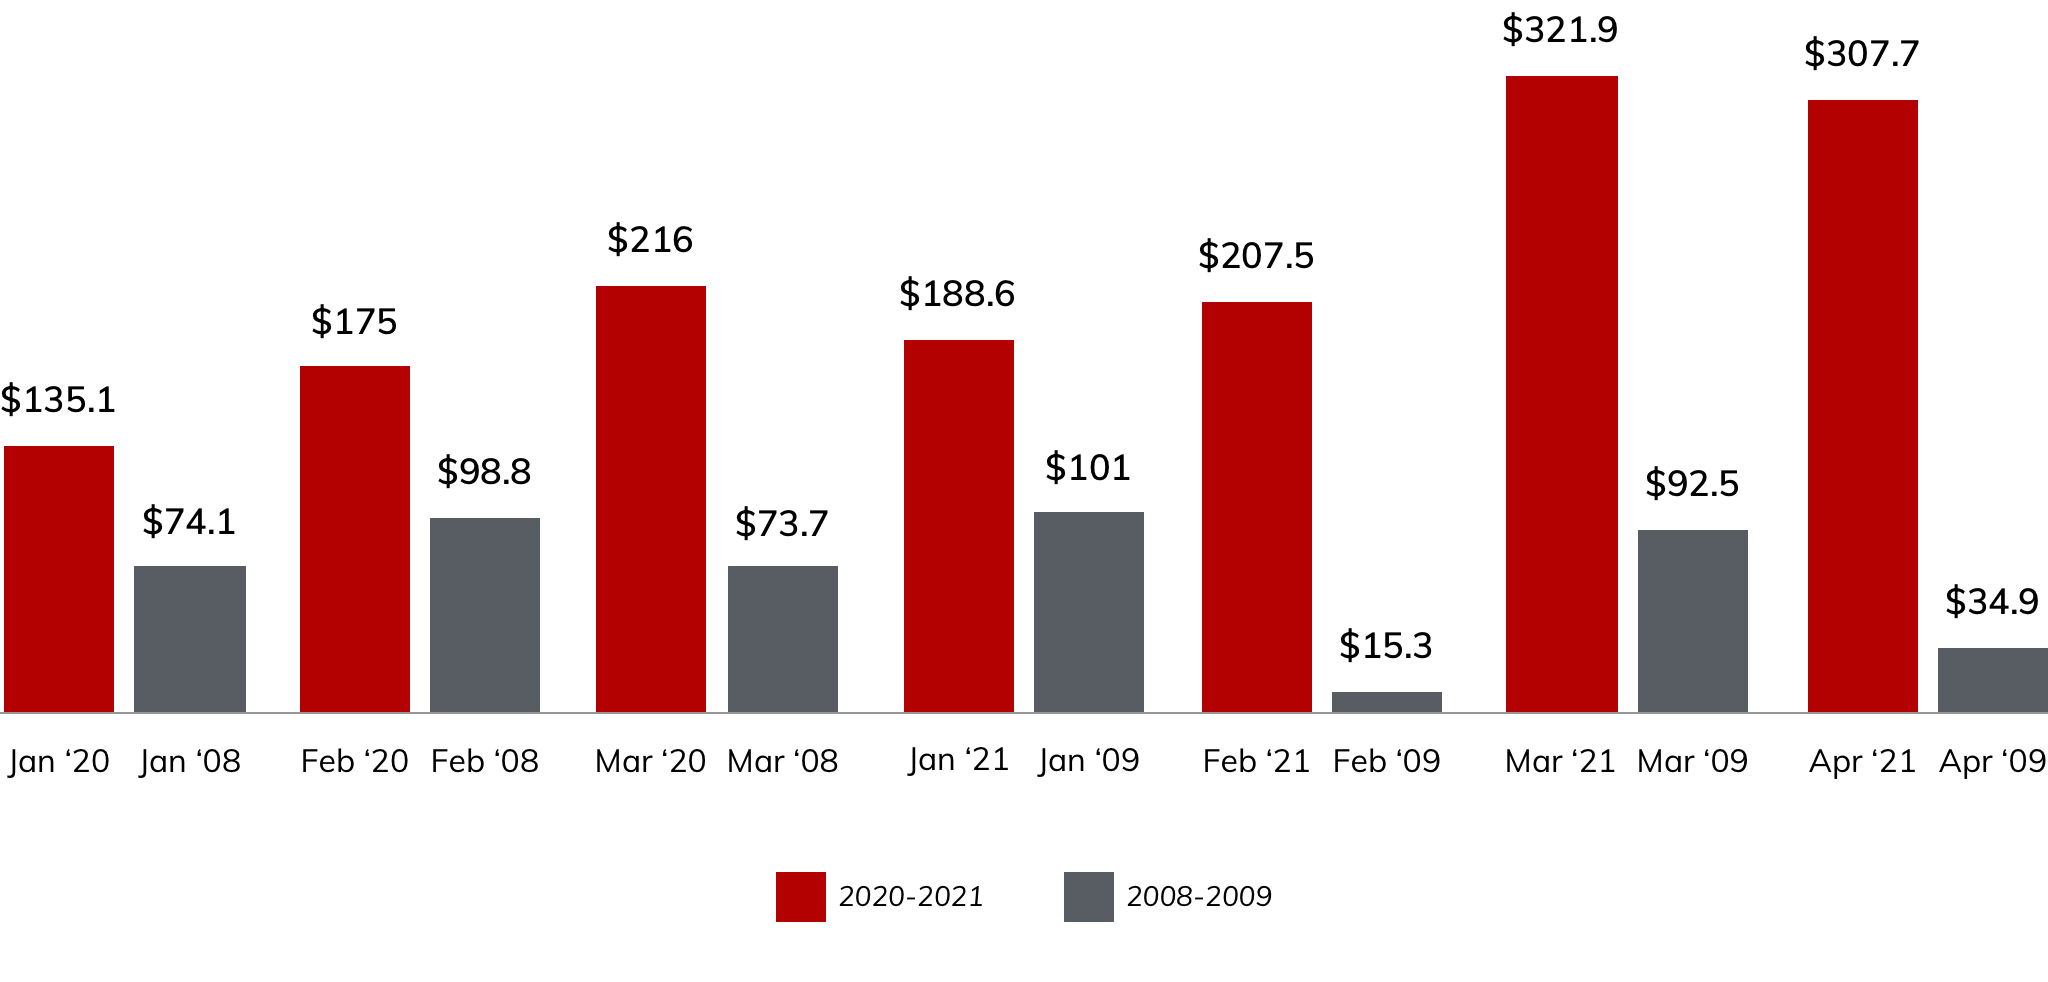
While the Covid-19 recession hit the market harder and faster than the economic crisis of 2008–09, the fast and aggressive response of the federal government this time around has helped minimize the long-term damage.
“There were also fewer businesses - including banks - over-leveraged this time,” Johnston says. “The steepness of the decline was sharper, but this recovery is much steeper, as well. I think it speaks well for where we’ll be in 2021 and beyond.”
M&A activity in North America
Value of all deals (in billions of dollars)

This article is prepared for general information purposes only and does not consider the specific investment objectives, financial situation and particular needs of any individual person or entity.
KeyBanc Capital Markets is a trade name under which corporate and investment banking products and services of KeyCorp and its subsidiaries, KeyBanc Capital Markets Inc., Member FINRA/SIPC, and KeyBank National Association are marketed. Securities products and services: NOT FDIC INSURED • NO BANK GUARANTEE • MAY LOSE VALUE
©2021 KeyCorp. KeyBank is Member FDIC. 210506-1047528
