The Global Grids Index
Power grids have been a success story since they were first constructed 150 years ago. Today, grids face an
unprecedented challenge as they must support most of the effort that the energy transition will require.
Grids will be greener, increasingly digital and more decentralized, enabling consumers to generate their own
renewable power and distribute it back to the grid. By 2050, a 152-million-kilometer supersized grid—enough cable to stretch all the way to the Sun—and an investment of $21.4 trillion is needed to support a net-zero trajectory, according to BloombergNEF. It also requires stable regulatory frameworks,
attractive revenues and digitalization at all levels.
So, which countries are most prepared to connect the renewable energy future? Bloomberg Media’s proprietary algorithm, created in partnership with Iberdrola, from the latest available data collated in 2023 measures who's leading and who's lagging.
Global Grids Index Scores
10 leading renewable energy markets have been scored using BNEF's Net Zero Scenario (100 = on track), using the following criteria:
*Situational KPls: parameters calculated usingavailable data for the period 2020-2023.**Structural KPls: parameters calculated using available data as of 2022-2023.
Country Profiles
Country Profiles
Renewable Connections
Generation mix
Generation mix is calculated as the cumulative wind and solar capacity installed as of 2022 divided by the total system peak demand in 2022. This metric is given a weight of 20% in the overall index.
Source: BloombergNEF.
Connection speed
Often, there is a lack of capacity on the network, which needs to be upgraded to cope with additional power generation. Planning processes can be enormously cumbersome and lengthy, and developers may have to pay fees, which can be so costly that they prevent projects from proceeding. In some markets, there is significant resistance to new overhead lines, which can slow down development or lead to a shift to underground cables, which are more expensive and compete for cable production capacity with the growing demand for submarine cables to service offshore wind farms and undersea interconnectors.
One key issue for developers is a lack of transparency about how long connections will take, making it hard for them to plan. Some regulators are starting to tackle this issue; the US Federal Energy Regulatory Commission, for example, is moving from a first-come, first-served system to a first-ready, first-served process. Some utilities face fines if they take too long to execute network connection plans.
Connection speed is calculated as the average capacity of annual wind and solar installations between 2020 and 2022 divided by the country's 2023 gross domestic product. This metric is given a weight of 20% in the overall index.
Sources: BloombergNEF, IMF.
Network Development
Network scale
It is no surprise that the biggest grids are in China, the US, India and Brazil—but even considering the size of the country and its economy, the Chinese grid is vast. This reflects the fact that many of its generation resources, particularly renewable resources, are in remote locations far from the coastal cities where demand is concentrated.
Network scale is calculated using a composite scale variable (CSV), harmonized by GDP, as a benchmarking tool employed by UK energy regulator Ofgem to assess capital expenditures for electric utilities. There are various versions of these composites, but the one used in this metric is as follows
CSV = Number of customers in millions 0.5 x Annual energy consumption in TWh 0.25 x Network length in thousand km 0.25
This method estimates the number of customers by calculating the number of households in the market, annual energy consumption and network length, which includes transmission and distribution grids above 1 kilovolt. This metric is given a weight of 10% in the overall index.
Sources: BloombergNEF, Ofgem.
Combined grid investment - divided into:
Grid investment to network scale
There are many paradigms for upgrading power systems. Some network operators have an "invest and connect" approach: They invest in the grid and then connect power generation projects when there is sufficient network capacity. Others operate a "connect and manage" system, allowing generation projects to connect to the network by managing the grid through curtailment, while the wider work of network reinforcement happens in parallel. The UK has one such system, but because the pace of grid connections has been so rapid, it has fallen behind in upgrading the grid and has hit the limits of what "connect and manage" can achieve.
This metric is calculated by dividing the investment in transmission and distribution grids in 2022 by the network scale metric calculated above. This metric is given a weight of 20% in the overall index.
Source: BloombergNEF.
Grid investment to renewable energy investment
This metric is calculated as the annual investment in transmission and distribution grids in 2022 divided by the average annual investment in renewable energy generation between 2020 and 2022. This metric is given a weight of 10% in the overall index.
Source: BloombergNEF.
Digitalization
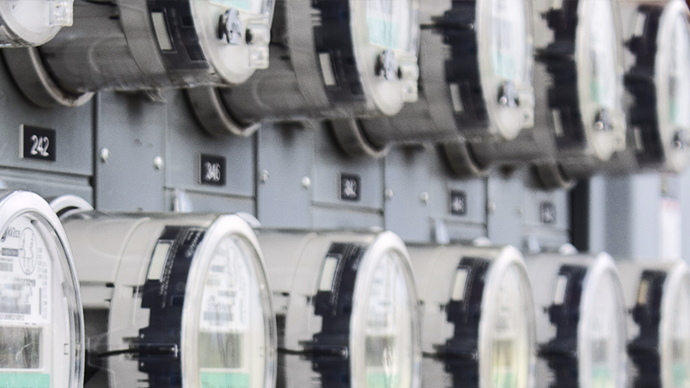
Smart meter penetration
According to the International Energy Agency, "Digital technologies can greatly improve the functioning of power grids to help successfully integrate clean energy sources, but a lack of investment in these networks could slow down the energy transition and increase costs, particularly in emerging and developing economies." The IEA says that digital technologies could save $1.8 trillion of grid investment globally through 2050 by extending the lifetime of grids, while also helping to integrate renewables and minimize supply interruptions.
A crucial first step in digitalization is smart meter penetration. Smart meters are an integral part of digital power architecture, giving consumers and producers greater awareness of how much power is being consumed and when. This transparency opens up the possibility of new products and services, including variable tariffs that encourage consumers to lean into the growing availability of renewable energy. Smart meters also enable homes that produce their own energy—primarily through solar PV—to sell their power back to the grid or to their neighbors.
Smart Meter Penetration is the share of customers with a smart meter. This metric is given a weight of 10% in the overall index.
Sources: ACER, Australian Energy Market Commission, Astute Analytica, Berg Insight, BloombergNEF, GII Research, Smart Energy International, UK government.
Energy Storage
Storage deployments
This metric is calculated as the sum of battery storage and pumped hydro capacity as of 2022 divided by the cumulative wind and solar capacity as of 2022. This metric is given a weight of 10% in the overall index.
Source: BloombergNEF.
Index data compiled August 2023–October 2024